
Liulin-MO, inside ESA-ROSCOSMOS ExoMars TGO satellite
Satellite provider: ESA
Experiment name: FREND
Instrument name: Liulin-MO
Cooperation: Bulgaria, Russia
Begin-end of data: 06.04.2016 -
PI/CoPI: , I. Mitrofanov, SRI, Moscow, J. Semkova, SRTI
Main description Reference: (Semkova et al., 2018 https://doi.org/10.1016/j.icarus.2017.12.034; http://exploration.esa.int/jump.cfm?oid=48523
Units: Size [mm]/Mass [kg]: Liulin-MO, 2x2 Dosimetric telescopes by 2 detectors (160х90х30 mm, 0.8 kg)
Place, Shielding [g cm-2]: Outside the ExoMars TGO satellite on FREND Instrument 1-100 g cm-2;
Resolution [sec]/[min]: 60 sec for dose rate and flux, 60 min for LET and deposited energy spectra
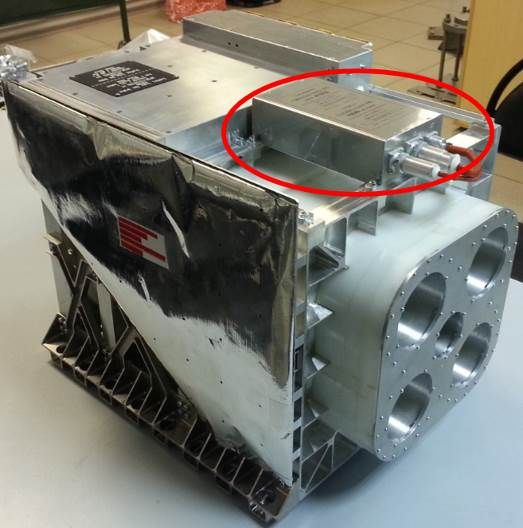

 Fig. 1 External view of FREND and Liulin-MO
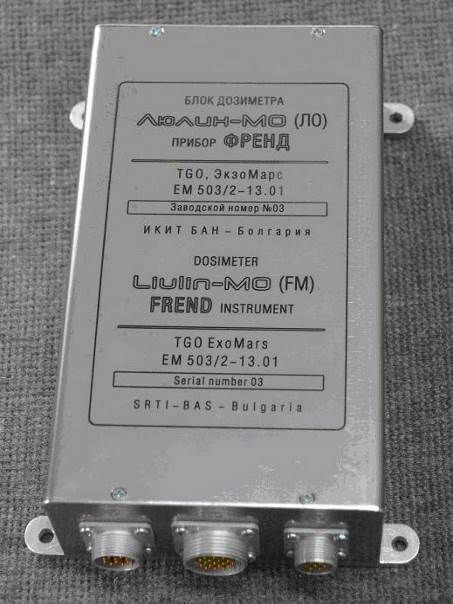
Fig. 2 External view of Liulin-MO instrument
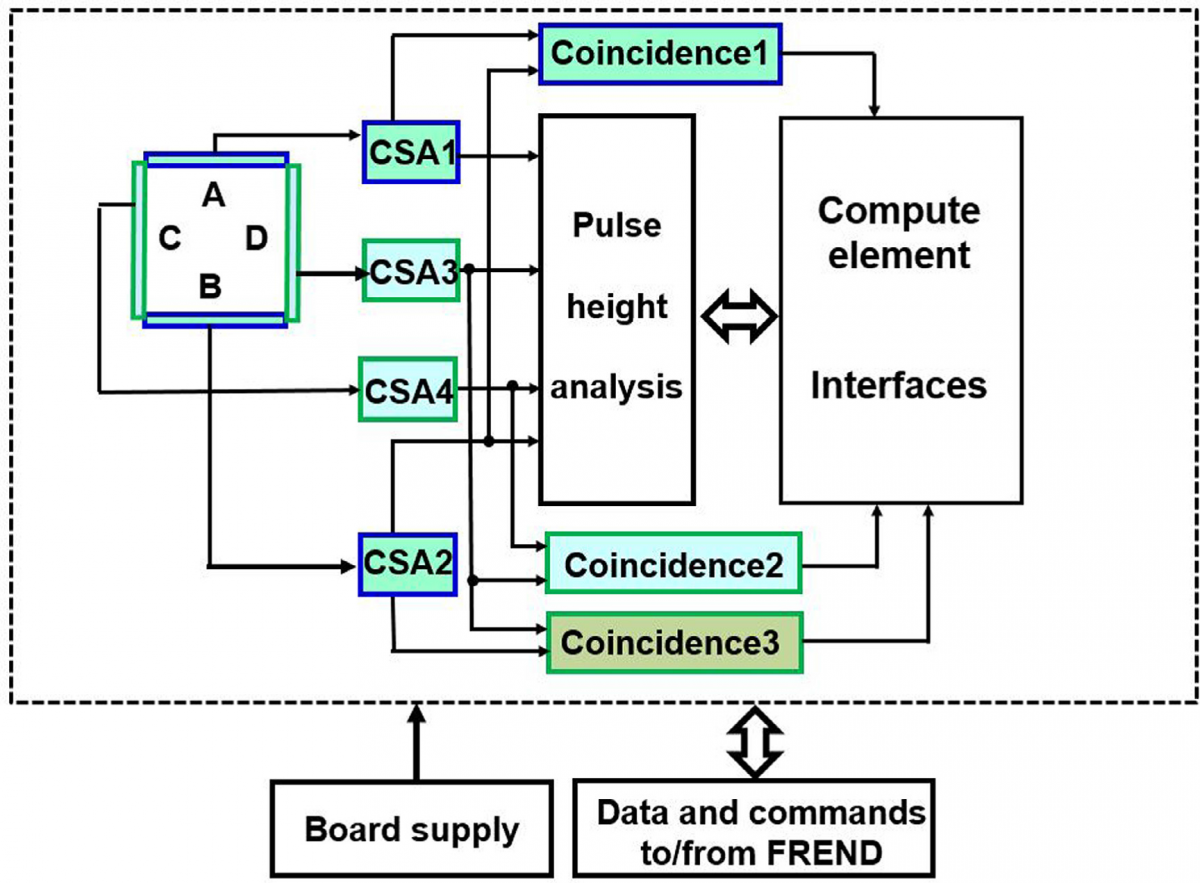
Fig. 3 Functional diagram of FREND dosimeter Liulin-MO.
Methodology and measured parameters of Liulin-MO
Liulin-MO contains two dosimetric telescopes—A&B, and C&D arranged at two perpendicular directions. Each pair of the dosimetric telescopes consists of two 300 μm thick, 20 ×10 mm area rectangular Si PIN photodiodes. The distance between the parallel Si PIN photodiodes is 20.8 mm. The geometry factor of the telescope for isotropic radiation is ∼1.38 cm 2 sr. The geometry factor of a single detector is ∼12.56 cm2 sr.
The functional diagram of the instrument shown in Fig. 3. The primary measured parameters are the amplitudes of the voltage pulses at the outputs of the charge-sensitive preamplifiers shaping amplifiers CSA1 to CSA4, connected to the detectors. The amplitude of a voltage pulse is proportional to the energy de- posited in the corresponding detector by a charged particle or a photon crossing the detector. By an 8-bit ADC these amplitudes are digitized and organized in a deposited 256 channel’s energy deposition spectrum for every one of the detectors.
The gains of Liulin-MO preamplifiers CSA1 to CSA4 are a compromise between the conflicting goals of measuring gamma rays, electrons and high-energy protons (which have very low LET and hence requires high gains) and covering the HZE spectrum (which requires low gains to measure highly ionizing particles such as iron). As a result of the compromise one of detectors in each pair of parallel detectors and its corresponding CSA measures and provides the energy deposition spectrum in the range ∼0.08 −18 MeV. Those are detectors preamplifiers B-CSA2 and D-CSA3. The gains of CSA2 and CSA3 are ∼240 mV MeV −1 . CSA2 and CSA3 are powered by + 5 V. This leads to a maximum energy deposition of ∼18 MeV that can be registered in these channels without electronic saturation. The other detector in each pair of parallel detectors and its corresponding CSA measures the energy deposition spectrum in the range ∼0.3–190 MeV. Those are detectors preamplifiers A-CSA1 and C-CSA4. The gains of CSA1 and CSA4 are ∼60 mV MeV-1. CSA1 and CSA4 are powered by + 12 V. This leads to a maximum energy deposition of ∼190 MeV that can be registered in these channels without electronic saturation. The energy deposition spectrum in the single detector A (or B) is obtained by combining the energy deposition spectrum measured by B-CSA2 in the range ∼0.08–15.9 MeV with the energy deposition spectrum measured by A-CSA1 in the range ∼16–190 MeV. The same procedure is used to obtain the energy deposition spectrum in the single detectors C and D. In that way each pair of two parallel detectors and their corresponding CSAs provide data in the energy deposition range ∼0.08–190 MeV.
A coincidence technique for the associated with each dosimetric telescope signals from the threshold discriminators is applied to obtain LET. The energy deposition spectra measured in A and B detectors in coincidence mode are recorded separately and used to obtain the LET spectrum in the direction of A B. This LET spectrum consists of low and high LET parts. The low LET part is obtained from the B coincidence spectrum in the energy deposition range ∼0.08–15.9 MeV and the high LET part is obtained from the A co- incidence spectrum in the energy deposition range ∼16–190 MeV. Similarly the energy deposition spectra measured in the C and D detectors in coincidence mode are recorded separately and used to obtain the LET spectrum in the perpendicular CD direction. In addition the instrument measures the energy deposition spectrum in B in coincidence with D, allowing estimation of the dose rate and particle flux in the B D direction as well.
The basic characteristics of the instrument’s detectors are summarized in Tables 1 and 2. The detectors’ efficiencies are assumed to be 1.0.
The energy deposited is converted to energy lost per unit of path length (dE/dx ) in silicon. A constant factor is applied to relate dE/dx in silicon to LET in water.
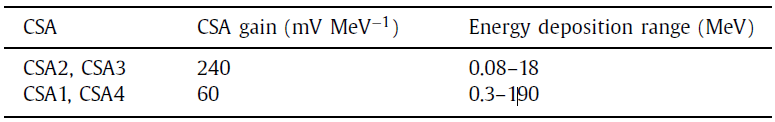
Table 1 Gains of Liulin–MO preamplifiers CSA and measurement range of the energy deposition of CSA.
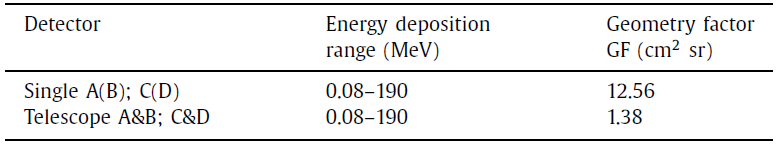
Table 2 Energy deposition range and geometry factors of the single detectors and dosimetric telescopes of Liulin-MO.

The energy deposited is converted to energy lost per unit of path length (dE/dx ) in silicon. A constant factor is applied to relate dE/dx in silicon to LET in water. The absorbed dose in a silicon detector D Si [Gy] is calculated by dividing the summarized energy deposition in the spectrum in Joules to the mass of the detector in kilograms:

![]()
where Ej is the average deposited energy of the particles registered in channel j of the energy deposition spectrum, nj is the number of particles in channel j, m is the mass of the detector’s sensitive volume.

![]()
where the coefficient ε converts the spectral channel number j to the deposited by a single particle (or a photon) energy Ej.
Consequently:

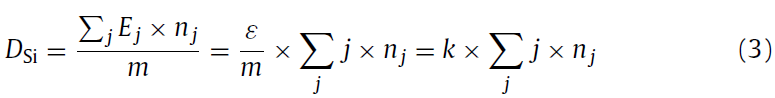
The coefficients ε and k depend on the CSA and ADC parameters. They are calculated and subsequently verified during the calibrations of the instrument.
The values i n j and i j ×n j proportional to the flux and to the dose for each detector are calculated on board from the corresponding energy deposition spectrum measured for a given time and are provided in the Liulin-MO output data.
The parameters, provided by Liulin-MO simultaneously for two perpendicular directions have the following ranges: absorbed dose rate from 10-7 Gy h-1 to 0.1 Gy h-1; particle flux in the range 0–104 cm-2 s-1; energy deposition spectrum and coincidence energy deposition spectrum in the range 0.08–190 MeV. The dose rates and the fluxes are resolved every minute, while the energy deposition spectra and the coincidence spectra are resolved every hour. The data transferred to FREND are 2 Mbits/day.
Available data
FREND and its dosimeter Liulin-MO were turned on for the first time on 06.04.2016 during initial check of the science instruments on-board TGO. All modules of FREND performed nominally.
From 22.04.2016 to 18.07.2016 one of the 3He and the scintillate detectors of FREND, as well as Liulin-MO were turned on almost continuously. From 19.07.2016 to 11.08.2016 during Deep Space Maneuvers of TGO all FREND modules were turned off.
From 11.08.2016 to 15.09.2016 Liulin-MO was turned on periodically. The Liulin-MO data for the period 22.04 ¸ 15.09 corresponds to TGO cruise to Mars. During that cruise the dosimeter has measured the dosimetric parameters of GCR. No SPE were registered by the dosimeter.
On 15.09.2016 FREND was turned off for the period during the operations for Mars orbit insertion and EDM release.
On 19.10.2016 TGO was inserted into high elliptic orbit (Mars capture orbit MCO1 with appocentre 98 000 km, pericentre 230 km, inclination to the equator 00 and 4.2 days orbit period).
FREND, including Liulin-MO, were turned on in MCO1 on 31.10.2016 and operated almost continuously until 17.01.2017.
After that, the operations for insertion of TGO in lower elliptic orbit with 37150 km appocentre, 200 km pericentre, 740 inclination, 24h 39 min orbit period (Mars capture orbit MCO2) followed. During those TGO maneuvers FREND was switched off.
From 24.02.2015 to 07.03.2015 FREND was turned on in MCO2.
On 15.03.2017 the aerobraking of TGO started, that will continue to April 2018. The aerobraking is expected to insert TGO in circular science orbit with distance from Mars about 400 km. During the aerobraking the science instruments onboard TGO will be switched off.
“DATA SOURCES” string description
Cruise to Mars
Date Time, X_tgo km, Y_tgo km, Z_tgo km, TGO-Earth km, TGO_Mars km, Flux AB, Flux CD, Dose AB, Dose CD.
Elliptic orbit around Mars
data time, Distance, X_pos, Y_pos, Z_pos, Altitude, Flux AB, Flux CD, Dose AB, Dose CD.
All files are in csv format. Link to “DATA SOURCES” files: http://esa-pro.space.bas.bg/datasources/LIULIN_MO
Additional references, concerning data:
Semkova, J., T. Dachev, St. Maltchev, B. Tomov, Yu. Matviichuk, P. Dimitrov, R. Koleva, I. Mitrofanov, A. Malakhov, M. Mokrousov, A. Sanin, M. Litvak, A. Kozyrev, V. Tretyakov, D. Golovin, S. Nikiforov, A. Vostrukhin, F. Fedosov, N. Grebennikova, V. Benghin, V. Shurshakov,et al., Radiation environment investigations during ExoMars missions to Mars - Objectives, experiments and instrumentation, Comptes rendus de l'Académie bulgare des sciences: sciences mathématiques et naturelles 68(4):485-496, January 2015.
Semkova, J., Koleva, R., Benghin, V., Dachev, T., Matviichuk, Y., Tomov, B., Krastev, K., Maltchev, S., Dimitrov, P., Mitrofanov, I. and Malahov, A., Charged particles radiation measurements with Liulin-MO dosimeter of FREND instrument aboard ExoMars Trace Gas Orbiter during the transit and in high elliptic Mars orbit. Icarus, 2018. https://doi.org/10.1016/j.icarus.2017.12.034
Please acknowledge data provider:
1. Jordanka Semkova, SRTI-BAS jsemkova@stil.bas.bg or: jordankasemkova@gmail.com
URL: https://scholar.google.com/citations?user=CIqDrmgAAAAJ&hl=en